Everything we think we know about migration is wrong

Reading How Migration Really Works by Hein de Haas for New Scientist, 8 November 2023

Three decades of research, conducted largely with teams at the University of Oxford and the University of Amsterdam, have gone into geographer Hein de Haas’s comprehensive, fascinating, often shocking survey of global migration. Everyone will arrive at this book nursing some opinion or other about migration. Few will finish with the preconceptions still intact. De Haas is out to show how everything we think we know about migration is wrong, not because migration is an especially complex matter, but because economic and political interests, on both the left and the right, have lost sight of the evidence, when they haven’t actively covered it up; both would rather shape public narratives out of just-so stories than resort to anything so dull and intransigent as fact.

The shibboleths surrounding migration are demolished in three waves. De Haas explores trends in global migration patterns, first, moves onto examine the impacts of migration on both destination and origin societies, and closes with a series of fairly devastating takedowns of popular ideas championed by politicians, interest groups and international organizations across the political spectrum.

How degraded has the evidential foundation around the migration debate become? Consider, for starters, frequently quoted figures released by UNHCR, the United Nations’ own refugee agency, which to show that the total number of displaced people in the world increased from 1.8 million in 1951 to 20 million in 2005, rose to 62 million in 2018, then leapt up to almost 89 million in 2021 and 100 million in 2022. What explains this shocking rise? Globalisation? War? Climate change? Or the inability to present statistics? “What appears to be an unprecedented increase in refugee numbers,” de Haas explains, with what weary patience one can only imagine, “is in reality a statistical artefact caused by the inclusion of populations and countries that were previously excluded from displacement statistics.” UNHCR’s current figures are truly global. Their 1951 figure, however, was drawn from a database covering just 21 countries.

Its the direction of migration in the post-war world that has proved so disconcerting. Former emigrant nations have become immigrant destinations. The numbers have fluctuated hardly at all. At any one time, three per cent of the world’s population are migrants. A tenth of those are refugees. The figure for unsolicited border crossings fluctuates wildly, depending on labour demand in destination countries (for illegal migration) and conflict in origin countries (for refugee migration), but the underlying figure remains consistent.

From where, then, comes all this Stürm und Drang around migration? De Haas pulls no punches. Both right and left have a vested interest in inflating migrant numbers, he says: “Although they may advocate very different solutions, politicians from left to right, climate activist and nativist groups, humanitarian NGOs and refugee organizations and media have all bought into the idea that the current era is one of a migration crisis.”

That this results in some staggeringly wrong-headed policy-making comes as no surprise — witness the massive US investment in border enforcement since the late 1980s that has turned a largely circular flow of Mexican workers into an 11-million-strong population of permanently settled families living all across the United States.

There’s also the cultural impact. In host nations including the UK, nightmare scenarios are regularly peddled to tickle every political palate. An international cabal controls people smuggling! (No evidence.) Across the world, the mafia are trafficking young women for sex! (No evidence.) Migration flows are predominantly from the impoverished South to the wealthy North! (Wrong.) Migration lifts all boats! (No: it overwhelmingly benefits the already affluent.) Few scenarios credit migrants themselves with foresight, agency, or even intelligence.

How Migration Really Works is a carefully evidenced diatribe against a political culture that would rather use migration as a domestic psychodrama than treat it as an ordinary and governable part of civics. To be pro-immigration, or anti-immigration, is to miss the point entirely. You wouldn’t ask an economist whether they’re for or against the economy, would you?

We’re constantly told we need “a big conversation” about immigration. I’m currently re-reading this book (something crabbed reviewers never normally do). And until I’m done, I’ll keep my big mouth firmly shut.

How many holes has a straw?

Reading Jordan Ellenberg’s Shape for the Telegraph, 7 July 2021

“One can’t help feeling that, in those opening years of the 1900s, something was in the air,” writes mathematician Jordan Ellenburg.

It’s page 90, and he’s launching into the second act of his dramatic, complex history of geometry (think “History of the World in 100 Shapes”, some of them very screwy indeed).
For page after reassuring page, we’ve been introduced to symmetry, to topology, and to the kinds of notation that make sense of knotty-sounding questions like “how many holes has a straw”?

Now, though, the gloves are off, as Ellenburg records the fin de siecle’s “painful recognition of some unavoidable bubbling randomness at the very bottom of things.”
Normally when sentiments of this sort are trotted out, they’re there to introduce readers to the wild world of quantum mechanics (and, incidentally, we can expect a lot of that sort of thing in the next few years: there’s a centenary looming). Quantum’s got such a grip on our imagination, we tend to forget that it was the johnny-come-lately icing on an already fairly indigestible cake.

A good twenty years before physical reality was shown to be unreliable at small scales, mathematicians were pretzeling our very ideas of space. They had no choice: at the Louisiana Purchase Exposition in 1904, Henri Poincarre, by then the world’s most famous geometer, described how he was trying to keep reality stuck together in light of Maxwell’s famous equations of electromagnetism (Maxwell’s work absolutely refused to play nicely with space). In that talk, he came startlingly close to gazumping Einstein to a theory of relativity.
Also at the same exposition was Sir Ronald Ross, who had discovered that malaria was carried by the bite of the anopheles mosquito. He baffled and disappointed many with his presentation of an entirely mathematical model of disease transmission — the one we use today to predict, well, just about everything, from pandemics to political elections.
It’s hard to imagine two mathematical talks less alike than those of Poincarre and Ross. And yet they had something vital in common: both shook their audiences out of mere three-dimensional thinking.

And thank goodness for it: Ellenburg takes time to explain just how restrictive Euclidean thinking is. For Euclid, the first geometer, living in the 4th century BC, everything was geometry. When he multiplied two numbers, he thought of the result as the area of a rectangle. When he multiplied three numbers, he called the result a “solid’. Euclid’s geometric imagination gave us number theory; but tying mathematical values to physical experience locked him out of more or less everything else. Multiplying four numbers? Now how are you supposed to imagine that in three-dimensional space?

For the longest time, geometry seemed exhausted: a mental gym; sometimes a branch of rhetoric. (There’s a reason Lincoln’s Gettysburg Address characterises the United States as “dedicated to the proposition that all men are created equal”. A proposition is a Euclidean term, meaning a fact that follows logically from self-evident axioms.)

The more dimensions you add, however, the more capable and surprising geometry becomes. And this, thanks to runaway advances in our calculating ability, is why geometry has become our go-to manner of explanation for, well, everything. For games, for example: and extrapolating from games, for the sorts of algorithmical processes we saddle with that profoundly unhelpful label “artificial intelligence” (“artificial alternatives to intelligence” would be better).

All game-playing machines (from the chess player on my phone to DeepMind’s AlphaGo) share the same ghost, the “Markov chain”, formulated by Andrei Markov to map the probabilistic landscape generated by sequences of likely choices. An atheist before the Russian revolution, and treated with predictable shoddiness after it, Markov used his eponymous chain, rhetorically, to strangle religiose notions of free will in their cradle.

From isosceles triangles to free will is quite a leap, and by now you will surely have gathered that Shape is anything but a straight story. That’s the thing about mathematics: it does not advance; it proliferates. It’s the intellectual equivalent of Stephen Leacock’s Lord Ronald, who “flung himself upon his horse and rode madly off in all directions”.

Containing multitudes as he must, Ellenberg’s eyes grow wider and wider, his prose more and more energetic, as he moves from what geometry means to what geometry does in the modern world.

I mean no complaint (quite the contrary, actually) when I say that, by about two-thirds the way in, Ellenberg comes to resemble his friend John Horton Conway. Of this game-playing, toy-building celebrity of the maths world, who died from COVID last year, Ellenburg writes, “He wasn’t being wilfully difficult; it was just the way his mind worked, more associative than deductive. You asked him something and he told you what your question reminded him of.”
This is why Ellenberg took the trouble to draw out a mind map at the start of his book. This and the index offer the interested reader (and who could possibly be left indifferent?) a whole new way (“more associative than deductive”) of re-reading the book. And believe me, you will want to. Writing with passion for a nonmathematical audience, Ellenberg is a popular educator at the top of his game.

A fanciful belonging

Reading The Official History of Britain: Our story in numbers as told by the Office for National Statistics by Boris Starling with David Bradbury for The Telegraph, 18 October 2020

Next year’s national census may be our last. Opinions are being sought as to whether it makes sense, any longer, for the nation to keep taking its own temperature every ten years. Discussions will begin in 2023. Our betters may conclude that the whole rigmarole is outdated, and that its findings can be gleaned more cheaply and efficiently by other methods.

How the UK’s national census was established, what it achieved, and what it will mean if it’s abandoned, is the subject of The Official History of Britain — a grand title for what is, to be honest, a rather messy book, its facts and figures slathered in weak and irrelevant humour, most of it to do with football, I suppose as an intellectual sugar lump for the proles.

Such condescension is archetypally British; and so too is the gimcrack team assembled to write this book. There is something irresistibly Dad’s Army about the image of David Bradbury, an old hand at the Office of National Statistics, comparing dad jokes with novelist Boris Starling, creator of Messiah’s DCI Red Metcalfe, who was played on the telly by Ken Stott.

The charm of the whole enterprise is undeniable. Within these pages you will discover, among other tidbits, the difference between critters and spraggers, whitsters and oliver men. Such were the occupations introduced into the Standard Classification of 1881. (Recent additions include YouTuber and dog sitter.) Nostalgia and melancholy come to the fore when the authors say a fond farewell to John and Margaret — names, deeply unfashionable now, that were pretty much compulsory for babies born between 1914 and 1964. But there’s rigour, too; I recommend the author’s highly illuminating analysis of today’s gender pay gap.

Sometimes the authors show us up for the grumpy tabloid zombies we really are. Apparently a sizeable sample of us, quizzed in 2014, opined that 15 per cent of all our girls under sixteen were pregnant. The lack of mathematical nous here is as disheartening as the misanthropy. The actual figure was a still worryingly high 0.5 per cent, or one in 200 girls. A 10-year Teenage Pregnancy Strategy was created to tackle the problem, and the figure for 2018 — 16.8 conceptions per 1000 women aged between 15 and 17 — is the lowest since records began.

This is why census records are important: they inform enlightened and effective government action. The statistician John Rickman said as much in a paper written in 1796, but his campaign for a national census only really caught on two years later, when the clergyman Thomas Malthus scared the living daylights out of everyone with his “Essay on the Principle of Population”. Three years later, ministers rattled by Malthus’s catalogue of checks on the population of primitive societies — war, pestilence, famine, and the rest — peeked through their fingers at the runaway population numbers for 1801.

The population of England then was the same as the population of Greater London now. The population of Scotland was almost exactly the current population of metropolitan Glasgow.

Better to have called it “The Official History of Britons”. Chapter by chapter, the authors lead us (wisely, if not too well) from Birth, through School, into Work and thence down the maw of its near neighbour, Death, reflecting all the while on what a difference two hundred years have made to the character of each life stage.

The character of government has changed, too. Rickman wanted a census because he and his parliamentary colleagues had almost no useful data on the population they were supposed to serve. The job of the ONS now, the writers point out, “is to try to make sure that policymakers and citizens can know at least as much about their populations and economies as the internet behemoths.”

It’s true: a picture of the state of the nation taken every ten years just doesn’t provide the granularity that could be fetched, more cheaply and more efficiently, from other sources: “smaller surveys, Ordnance Survey data, GP registrations, driving licence details…”

But this too is true: near where I live there is a pedestrian crossing. There is a button I can push, to change the lights, to let me cross the road. I know that in daylight hours, the button is a dummy, that the lights are on a timer, set in some central office, to smooth the traffic flow. Still, I press that button. I like that button. I appreciate having my agency acknowledged, even in a notional, fanciful way.

Next year, 2021, I will tell the census who and what I am. It’s my duty as a citizen, and also my right, to answer how I will. If, in 2031, the state decides it does not need to ask me who I am, then my idea of myself as a citizen, notional as it is, fanciful as it is, will be impoverished.

Know when you’re being played

Calling Bullshit by Jevin D West and Carl T Bergstrom, and Science Fictions by Stuart Ritchie, reviewed for The Telegraph, 8 August 2020

Last week I received a press release headlined “1 in 4 Brits say ‘No’ to Covid vaccine”. This is was such staggeringly bad news, I decided it couldn’t possibly be true. And sure enough, it wasn’t.

Armed with the techniques taught me by biologist Carl Bergstrom and data scientist Jevin West, I “called bullshit” on this unwelcome news, which after all bore all the hallmarks of clickbait.

For a start, the question on which the poll was based was badly phrased. On closer reading it turns out that 25 per cent would decline if the government “made a Covid-19 vaccine available tomorrow”. Frankly, if it was offered *tomorrow* I’d be a refusenik myself. All things being equal, I prefer my medicines tested first.

But what of the real meat of the claim — that daunting figure of “25 per cent”?  It turns out that a sample of 2000 was selected from a sample of 17,000 drawn from the self-selecting community of subscribers to a lottery website. But hush my cynicism: I am assured that the sample of 2000 was “within +/-2% of ONS quotas for Age, Gender, Region, SEG, and 2019 vote, using machine learning”. In other words, some effort has been made to make the sample of 2000 representative of the UK population (but only on five criteria, which is not very impressive. And that whole “+/-2%” business means that up to 40 of the sample weren’t representative of anything).

For this, “machine learning” had to be employed (and, later, “a proprietary machine learning system”)? Well, of course not.  Mention of the miracle that is artificial intelligence is almost always a bit of prestidigitation to veil the poor quality of the original data. And anyway, no amount of “machine learning” can massage away the fact that the sample was too thin to serve the sweeping conclusions drawn from it (“Only 1 in 5 Conservative voters (19.77%) would say No” — it says, to two decimal places, yet!) and is anyway drawn from a non-random population.

Exhausted yet? Then you may well find Calling Bullshit essential reading. Even if you feel you can trudge through verbal bullshit easily enough, this book will give you the tools to swim through numerical snake-oil. And this is important, because numbers easily slip  past the defences we put up against mere words. Bergstrom and West teach a course at the University of Washington from which this book is largely drawn, and hammer this point home in their first lecture: “Words are human constructs,” they say; “Numbers seem to come directly from nature.”

Shake off your naive belief in the truth or naturalness of the numbers quoted in new stories and advertisements, and you’re half way towards knowing when you’re being played.

Say you diligently applied the lessons in Calling Bullshit, and really came to grips with percentages, causality, selection bias and all the rest. You may well discover that you’re now ignoring everything — every bit of health advice, every over-wrought NASA announcement about life on Mars, every economic forecast, every exit poll. Internet pioneer Jaron Lanier reached this point last year when he came up with Ten Arguments for Deleting Your Social Media Accounts Right Now. More recently the best-selling Swiss pundit Rolf Dobelli has ordered us to Stop Reading the News. Both deplore our current economy of attention, which values online engagement over the provision of actual information (as when, for instance, a  review like this one gets headlined “These Two Books About Bad Data Will Break Your Heart”; instead of being told what the piece is about, you’re being sold on the promise of an emotional experience).

Bergstrom and West believe that public education can save us from this torrent of micro-manipulative blither. Their book is a handsome contribution to that effort. We’ve lost Lanier and Dobelli, but maybe the leak can be stopped up. This, essentially, is what the the authors are about; they’re shoring up the Enlightenment ideal of a civic society governed by reason.

Underpinning this ideal is science, and the conviction that the world is assembled on a bedrock of truth fundamentally unassailable truths.

Philosophical nit-picking apart, science undeniably works. But in Science Fictions Stuart Ritchie, a psychologist based at King’s College, shows just how contingent and gimcrack and even shoddy the whole business can get. He has come to praise science, not to bury it; nevertheless, his analyses of science’s current ethical ills — fraud, hype, negligence and so on — are devastating.

The sheer number of problems besetting the scientific endeavour becomes somewhat more manageable once we work out which ills are institutional, which have to do with how scientists communicate, and which are existential problems that are never going away whatever we do.

Our evolved need to express meaning through stories is an existential problem. Without stories, we can do no thinking worth the name, and this means that we are always going to prioritise positive findings over negative ones, and find novelties more charming than rehearsed truths.

Such quirks of the human intellect can be and have been corrected by healthy institutions at least some of the time over the last 400-odd years. But our unruly mental habits run wildly out of control once they are harnessed to a media machine driven by attention.  And the blame for this is not always easily apportioned: “The scenario where an innocent researcher is minding their own business when the media suddenly seizes on one of their findings and blows it out of proportion is not at all the norm,” writes Ritchie.

It’s easy enough to mount a defence of science against the tin-foil-hat brigade, but Ritchie is attempting something much more discomforting: he’s defending science against scientists. Fraudulent and negligent individuals fall under the spotlight occasionally, but institutional flaws are Ritchie’s chief target.

Reading Science Fictions, we see field after field fail to replicate results, correct mistakes, identify the best lines of research, or even begin to recognise talent. In Ritchie’s proffered bag of solutions are desperately needed reforms to the way scientific work is published and cited, and some more controversial ideas about how international mega-collaborations may enable science to catch up on itself and check its own findings effectively (or indeed at all, in the dismal case of economic science).

At best, these books together offer a path back to a civic life based on truth and reason. At worst, they point towards one that’s at least a little bit defended against its own bullshit. Time will tell whether such efforts can genuinely turning the ship around, or are simply here to entertain us with a spot of deckchair juggling. But there’s honest toil here, and a lot of smart thinking with it. Reading both, I was given a fleeting, dizzying reminder of what it once felt like to be a free agent in a factual world.

“So that’s how the negroes of Georgia live!”

Visiting W.E.B. Du Bois: Charting Black Lives, at the House of Illustration, London, for the Spectator, 25 January 2020

William Edward Burghardt Du Bois was born in Massachusetts in 1868, three years after the official end of slavery in the United States. He grew up among a small, tenacious business- and property-owning black middle class who had their own newspapers, their own schools and universities, their own elected officials.

After graduating with a PhD in history from Harvard University, Du Bois embarked on a sprawling study of African Americans living in Philadelphia. At the historically black Atlanta University in 1897, he established international credentials as a pioneer of the newfangled science of sociology. His students were decades ahead of their counterparts in the Chicago school.

In the spring of 1899, Du Bois’s son Burghardt died, succumbing to sewage pollution in the Atlanta water supply. ‘The child’s death tore our lives in two,’ Du Bois later wrote. His response: ‘I threw myself more completely into my work.’

A former pupil, the black lawyer Thomas Junius Calloway, thought that Du Bois was just the man to help him mount an exhibition to demonstrate the progress that had been made by African Americans. Funded by Congress and planned for the Paris Exposition of 1900, the project employed around a dozen clerks, students and former students to assemble and run ‘the great machinery of a special census’.

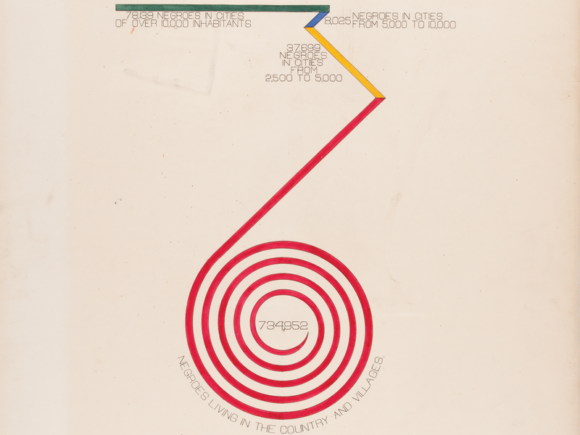
Two studies emerged. ‘The Georgia Negro’, comprising 32 handmade graphs and charts, captured a living community in numbers: how many black children were enrolled in public schools, how far family budgets extended, what people did for work, even the value of people’s kitchen furniture.

The other, a set of about 30 statistical graphics, was made by students at Atlanta University and considered the African American population of the whole of the United States. Du Bois was struck by the fact that the illiteracy of African Americans was ‘less than that of Russia, and only equal to that of Hungary’. A chart called ‘Conjugal Condition’ suggests that black Americans were more likely to be married than Germans.

The Exposition Universelle of 1900 brought all the world to the banks of the Seine. Assorted Africans, shipped over for the occasion, found themselves in model native villages performing bemused and largely made-up rituals for the visitors. (Some were given a truly lousy time by their bosses; others lived for the nightlife.) Meanwhile, in a theatre made of plaster and drapes, the Japanese geisha Sada Yacco, wise to this crowd from her recent US tour, staged a theatrical suicide for herself every couple of hours.

The expo also afforded visitors more serious windows on the world. Du Bois scraped together enough money to travel steerage to Paris to oversee his exhibition’s installation at the Palace of Social Economy.

He wasn’t overly impressed by the competition. ‘There is little here of the “science of society”,’ he remarked, and the organisers of the Exposition may well have agreed with him: they awarded him a gold medal for what Du Bois called, with justifiable pride, ‘an honest, straightforward exhibit of a small nation of people, picturing their life and development without apology or gloss, and above all made by themselves’.

At the House of Illustration in London you too can now follow the lines, bars and spirals that reveal how black wealth, literacy and land ownership expanded over the four decades since emancipation.

His exhibition also included what he called ‘the usual paraphernalia for catching the eye — photographs, models, industrial work, and pictures’, so why did Du Bois include so many charts, maps and diagrams?

The point about data is that it looks impersonal. It is a way of separating your argument from what people think of you, and this makes it a powerful weapon in the hands of those who find themselves mistrusted in politics and wider society. Du Bois and his community, let’s not forget, were besieged — by economic hardship, and especially by the Jim Crow laws that would outlive him by two years (he died in 1963).

Du Bois pioneered sociology, not statistics. Means of visualising data had entered academia more than a century before, through the biographical experiments of Joseph Priestly. His timeline charts of people’s lives and relative lifespans had proved popular, inspiring William Playfair’s invention of the bar chart. Playfair, an engineer and political economist, published his Commercial and Political Atlas in London in 1786. It was the first major work to contain statistical graphs. More to the point, it was the first time anyone had tried to visualise an entire nation’s economy.

Statistics and their graphic representation were quickly established as an essential, if specialised, component of modern government. There was no going back. Metrics are a self-fertilising phenomenon. Arguments over figures, and over the meaning of figures, can only generate more figures. The French civil engineer Charles Joseph Minard used charts in the 1840s to work out how to monetise freight on the newfangled railroads, then, in retirement, and for a hobby, used two colours and six dimensions of data to visualise Napoleon’s invasion and retreat during the 1812 campaign of Russia.

And where society leads, science follows. John Snow founded modern epidemiology when his annotated map revealed the source of an outbreak of cholera in London’s Soho. English nurse Florence Nightingale used information graphics to persuade Queen Victoria to improve conditions in military hospitals.

Rightly, we care about how accurate or misleading infographics can be. But let’s not forget that they should be beautiful. The whole point of an infographic is, after all, to capture attention. Last year, the House of Illustration ran a tremendous exhibition of the work of Marie Neurath who, with her husband Otto, dreamt up a way of communicating, without language, by means of a system of universal symbols. ‘Words divide, pictures unite’ was the slogan over the door of their Viennese design institute. The couple’s aspirations were as high-minded as their output was charming. The Neurath stamp can be detected, not just in kids’ picture books, but across our entire designscape.

Infographics are prompts to the imagination. (One imagines at least some of the 50 million visitors to the Paris Expo remarking to each other, ‘So that’s how the negroes of Georgia live!’) They’re full of facts, but do they convey them more effectively than language? I doubt it. Where infographics excel is in eliciting curiosity and wonder. They can, indeed, be downright playful, as when Fritz Kahn, in the 1920s, used fast trains, street traffic, dancing couples and factory floors to describe, by visual analogy, the workings of the human body.

Du Bois’s infographics aren’t rivals to Kahn or the Neuraths. Rendered in ink, gouache watercolour and pencil, they’re closer in spirit to the hand-drawn productions of Minard and Snow. They’re the meticulous, oh-so-objective statements of a proud, decent, politically besieged people. They are eloquent in their plainness, as much as in their ingenuity, and, given a little time and patience, they prove to be quite unbearably moving.

Maths into English

One to Nine by Andrew Hodges and The Tiger that Isn’t by Michael Blastland and Andrew Dilnot
reviewed for the Telegraph, 22 September 2007

Twenty-four years have passed since Andrew Hodges published his biography of the mathematician Alan Turing. Hodges, a long-term member of the Mathematical Physics Research Group at Oxford, has spent the years since exploring the “twistor geometry” developed by Roger Penrose, writing music and dabbling with self-promotion.

Follow the link to One to Nine’s web page, and you will soon be stumbling over the furniture of Hodges’s other lives: his music, his sexuality, his ambitions for his self?published novel – the usual spillage. He must be immune to bathos, or blind to it. But why should he care what other people think? He knows full well that, once put in the right order, these base metals will be transformed.

“Writing,” says Hodges, “is the business of turning multi?dimensional facts and ideas into a one?dimensional string of symbols.”

One to Nine – ostensibly a simple snapshot of the mathematical world – is a virtuoso stream of consciousness containing everything important there is to say about numbers (and Vaughan Williams, and climate change, and the Pet Shop Boys) in just over 300 pages. It contains multitudes. It is cogent, charming and deeply personal, all at once.

“Dense” does not begin to describe it. There is extraordinary concision at work. Hodges covers colour space and colour perception in two or three pages. The exponential constant e requires four pages. These examples come from the extreme shallow end of the mathematical pool: there are depths here not everyone will fathom. But this is the point: One to Nine makes the unfathomable enticing and gives the reader tremendous motivation to explore further.

This is a consciously old-fashioned conceit. One to Nine is modelled on Constance Reid’s 1956 classic, From Zero to Infinity. Like Reid’s, each of Hodges’s chapters explores the ideas associated with a given number. Mathematicians are quiet iconoclasts, so this is work that each generation must do for itself.

When Hodges considers his own contributions (in particular, to the mathematics underpinning physical reality), the skin tightens over the skull: “The scientific record of the past century suggests that this chapter will soon look like faded pages from Eddington,” he writes. (Towards the end of his life, Sir Arthur Eddington, who died in 1944, assayed a “theory of everything”. Experimental evidence ran counter to his work, which today generates only intermittent interest.)

But then, mathematics “does not have much to do with optimising personal profit or pleasure as commonly understood”.

The mordant register of his prose serves Hodges as well as it served Turing all those years ago. Like Turing: the Enigma, One to Nine proceeds, by subtle indirection, to express a man through his numbers.

If you think organisations, economies or nations would be more suited to mathematical description, think again. Michael Blastland and Andrew Dilnot’s The Tiger that Isn’t contains this description of the International Passenger Survey, the organisation responsible for producing many of our immigration figures:

The ferry heaves into its journey and, equipped with their passenger vignettes, the survey team members also set off, like Attenboroughs in the undergrowth, to track down their prey, and hope they all speak English. And so the tides of people swilling about the world?… are captured for the record if they travel by sea, when skulking by slot machines, half?way through a croissant, or off to the ladies’ loo.

Their point is this: in the real world, counting is back-breaking labour. Those who sieve the world for numbers – surveyors, clinicians, statisticians and the rest – are engaged in difficult work, and the authors think it nothing short of criminal the way the rest of us misinterpret, misuse or simply ignore their hard-won results. This is a very angry and very funny book.

The authors have worked together before, on the series More or Less – BBC Radio 4’s antidote to the sort of bad mathematics that mars personal decision-making, political debate, most press releases, and not a few items from the corporation’s own news schedule.

Confusion between correlation and cause, wild errors in the estimation of risk, the misuse of averages: Blastland and Dilnot round up and dispatch whole categories of woolly thinking.

They have a positive agenda. A handful of very obvious mathematical ideas – ideas they claim (with a certain insouciance) are entirely intuitive – are all we need to wield the numbers for ourselves; with them, we will be better informed, and will make more realistic decisions.

This is one of those maths books that claims to be self?help, and on the evidence presented here, we are in dire need of it. A late chapter contains the results of a general knowledge quiz given to senior civil servants in 2005.

The questions were simple enough. Among them: what share of UK income tax is paid by the top one per cent of earners? For the record, in 2005 it was 21 per cent. Our policy?makers didn’t have a clue.

“The deepest pitfall with numbers owes nothing to the numbers themselves and much to the slack way they are treated, with carelessness all the way to contempt.”

This jolly airport read will not change all that. But it should stir things up a bit.